Most efficient EVs: 2017 model year
Every EV with a published EPA combined efficiency, lowest energy use first, in kilowatt-hours per 100 miles. Fewer kWh per 100 miles means a cheaper charge for the same distance.
30 of 30 EVs have a published EPA efficiency figure
- 1

Photo credit
25.0 kWh/100 mi
Compare the 2017 Hyundai Ioniq Electric - 2

Photo credit
Photo: Vauxford, CC BY-SA 4.0
26.8 kWh/100 mi
Compare the 2017 Tesla Model 3 Long Range - 3

Photo credit
Photo: Zytonits, CC BY-SA 2.0
27.0 kWh/100 mi
Compare the 2017 BMW i3 60 Ah - 4

Photo credit
Photo: Kevauto, CC BY-SA 4.0
28.3 kWh/100 mi
Compare the 2017 Chevrolet Bolt EV - 5

Photo credit
Photo: Vauxford, CC BY-SA 4.0
28.4 kWh/100 mi
Compare the 2017 Volkswagen e-Golf - 6
Photo credit
Photo: Zytonits, CC BY-SA 2.0
29.0 kWh/100 mi
Compare the 2017 BMW i3 94 Ah - 7

Photo credit
Photo: Rutger van der Maar, CC BY 2.0
30.0 kWh/100 mi
Compare the 2017 Fiat 500e - 7
30.0 kWh/100 mi
Compare the 2017 Honda Clarity Electric - 7

Photo credit
Photo: DestinationFearFan, CC BY-SA 4.0
30.0 kWh/100 mi
Compare the 2017 Mitsubishi i-MiEV - 7

Photo credit
Photo: Makizox, CC BY-SA 4.0
30.0 kWh/100 mi
Compare the 2017 Nissan Leaf - 11
31.0 kWh/100 mi
Compare the 2017 Ford Focus Electric - 11
31.0 kWh/100 mi
Compare the 2017 Smart fortwo electric drive Coupe - 13

Photo credit
Photo: Vauxford, CC BY-SA 4.0
32.0 kWh/100 mi
Compare the 2017 Kia Soul EV - 13
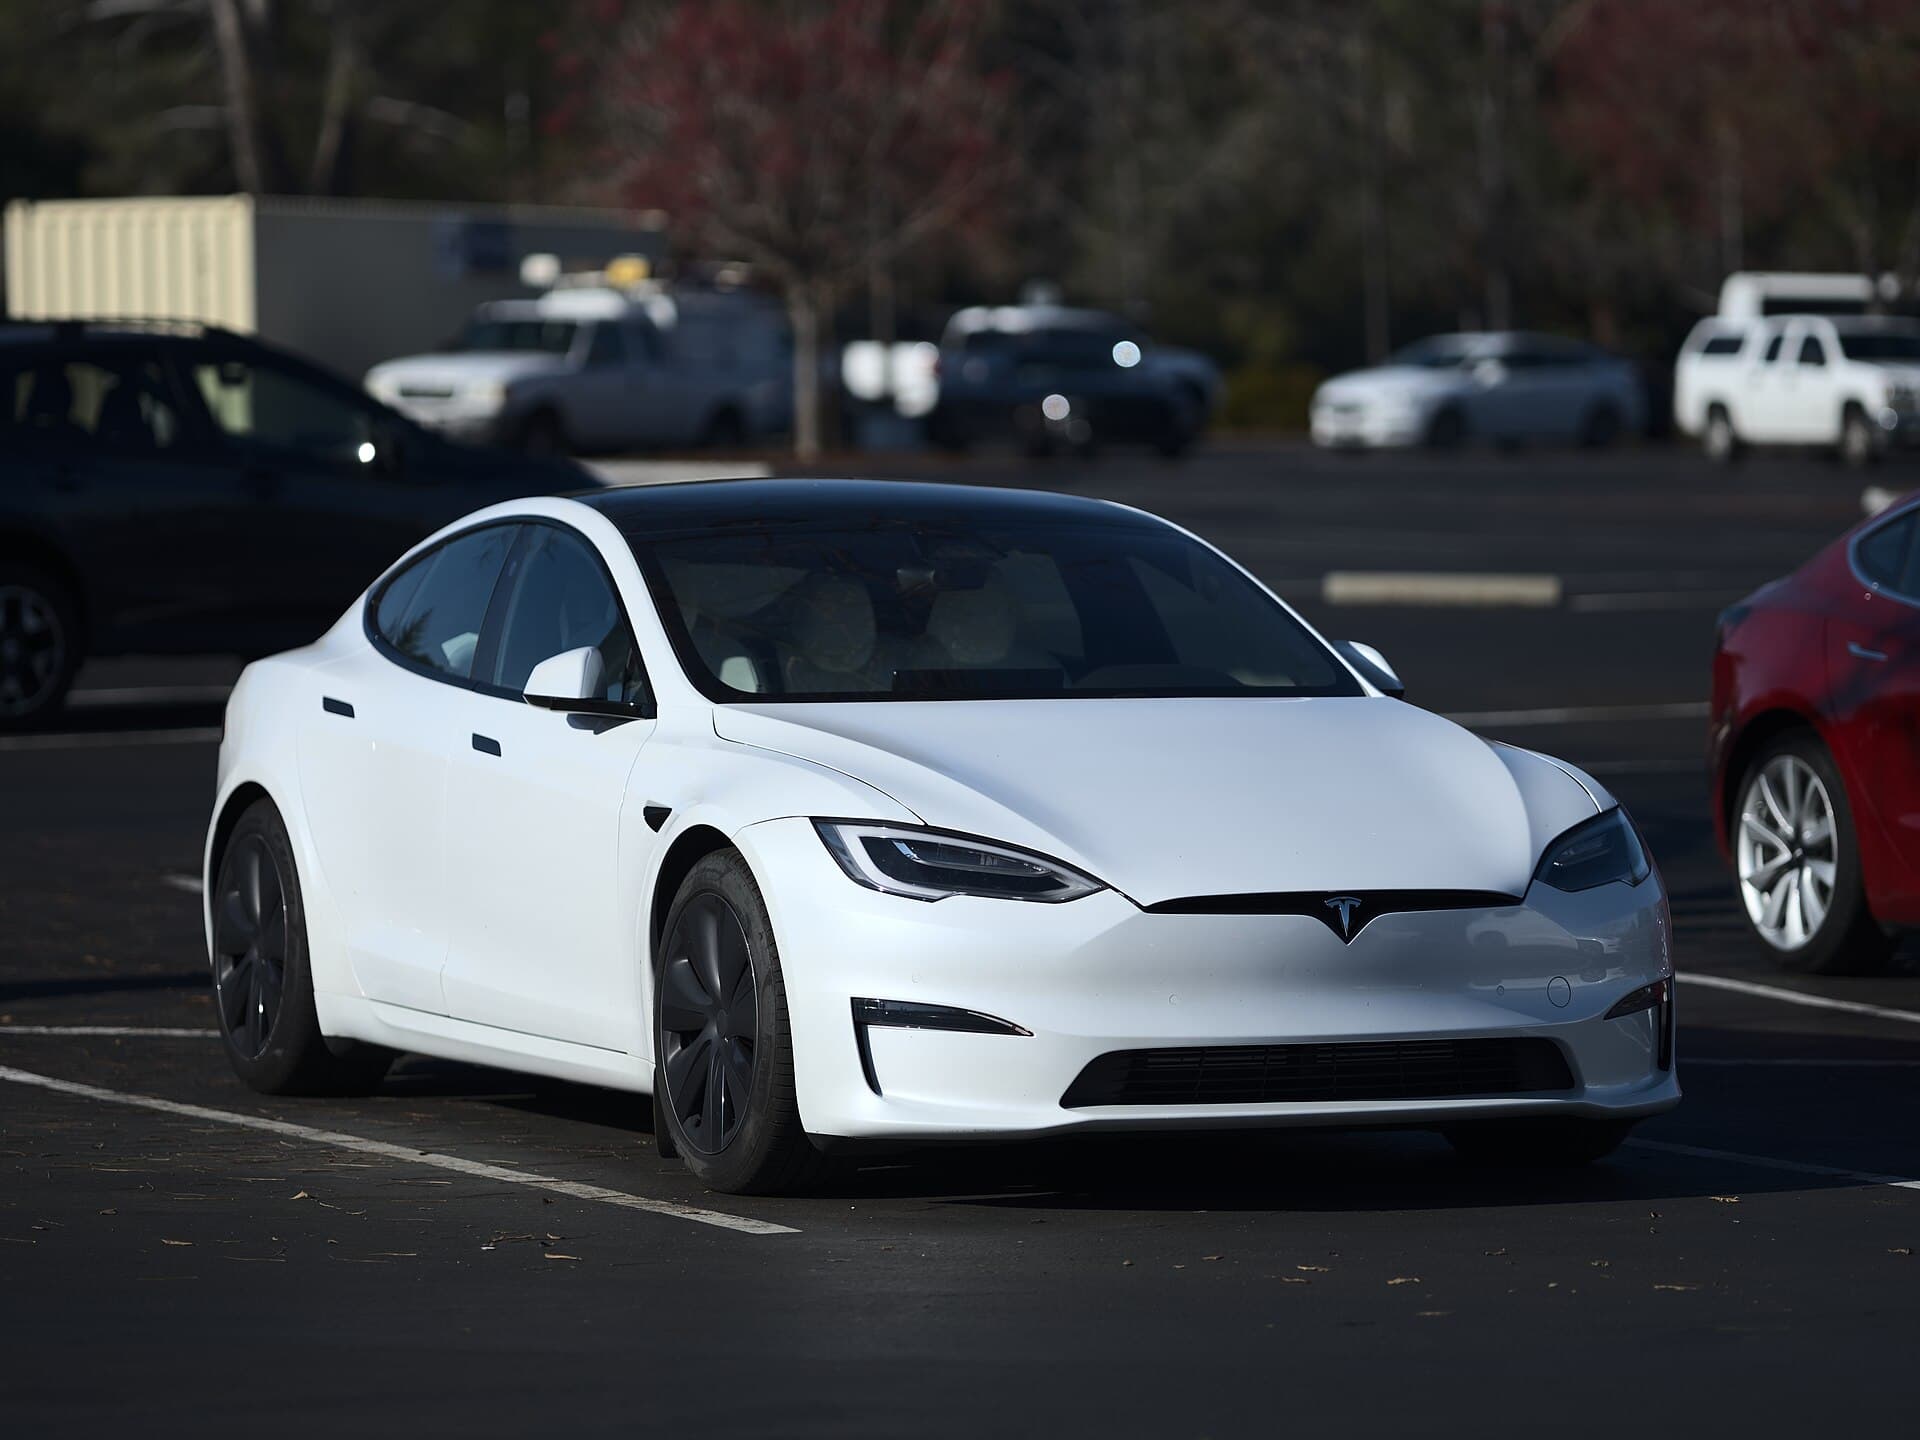
Photo credit
Photo: Dllu, CC BY-SA 4.0
32.0 kWh/100 mi
Compare the 2017 Tesla Model S 60D - 13
Photo credit
Photo: Dllu, CC BY-SA 4.0
32.0 kWh/100 mi
Compare the 2017 Tesla Model S 90D - 16
33.0 kWh/100 mi
Compare the 2017 Smart fortwo electric drive Cabrio - 16
Photo credit
Photo: Dllu, CC BY-SA 4.0
33.0 kWh/100 mi
Compare the 2017 Tesla Model S 75D - 16
Photo credit
Photo: Dllu, CC BY-SA 4.0
33.0 kWh/100 mi
Compare the 2017 Tesla Model S 100D - 19
Photo credit
Photo: Dllu, CC BY-SA 4.0
34.0 kWh/100 mi
Compare the 2017 Tesla Model S 60 kWh - 19
Photo credit
Photo: Dllu, CC BY-SA 4.0
34.0 kWh/100 mi
Compare the 2017 Tesla Model S 75 kWh - 21
Photo credit
Photo: Dllu, CC BY-SA 4.0
35.0 kWh/100 mi
Compare the 2017 Tesla Model S P90D - 21
Photo credit
Photo: Dllu, CC BY-SA 4.0
35.0 kWh/100 mi
Compare the 2017 Tesla Model S P100D - 23

Photo credit
Photo: Vauxford, CC BY-SA 4.0
36.0 kWh/100 mi
Compare the 2017 Tesla Model X 60D - 23
Photo credit
Photo: Vauxford, CC BY-SA 4.0
36.0 kWh/100 mi
Compare the 2017 Tesla Model X 75D - 25
Photo credit
Photo: Vauxford, CC BY-SA 4.0
37.0 kWh/100 mi
Compare the 2017 Tesla Model X 90D - 26
Photo credit
Photo: Vauxford, CC BY-SA 4.0
38.0 kWh/100 mi
Compare the 2017 Tesla Model X P90D - 27
Photo credit
Photo: Vauxford, CC BY-SA 4.0
38.7 kWh/100 mi
Compare the 2017 Tesla Model X 100D - 28
Photo credit
Photo: Vauxford, CC BY-SA 4.0
39.0 kWh/100 mi
Compare the 2017 Tesla Model X P100D - 29

Photo credit
Photo: DestinationFearFan, CC BY-SA 4.0
40.2 kWh/100 mi
Compare the 2017 Mercedes B-Class Electric Drive B250e - 30
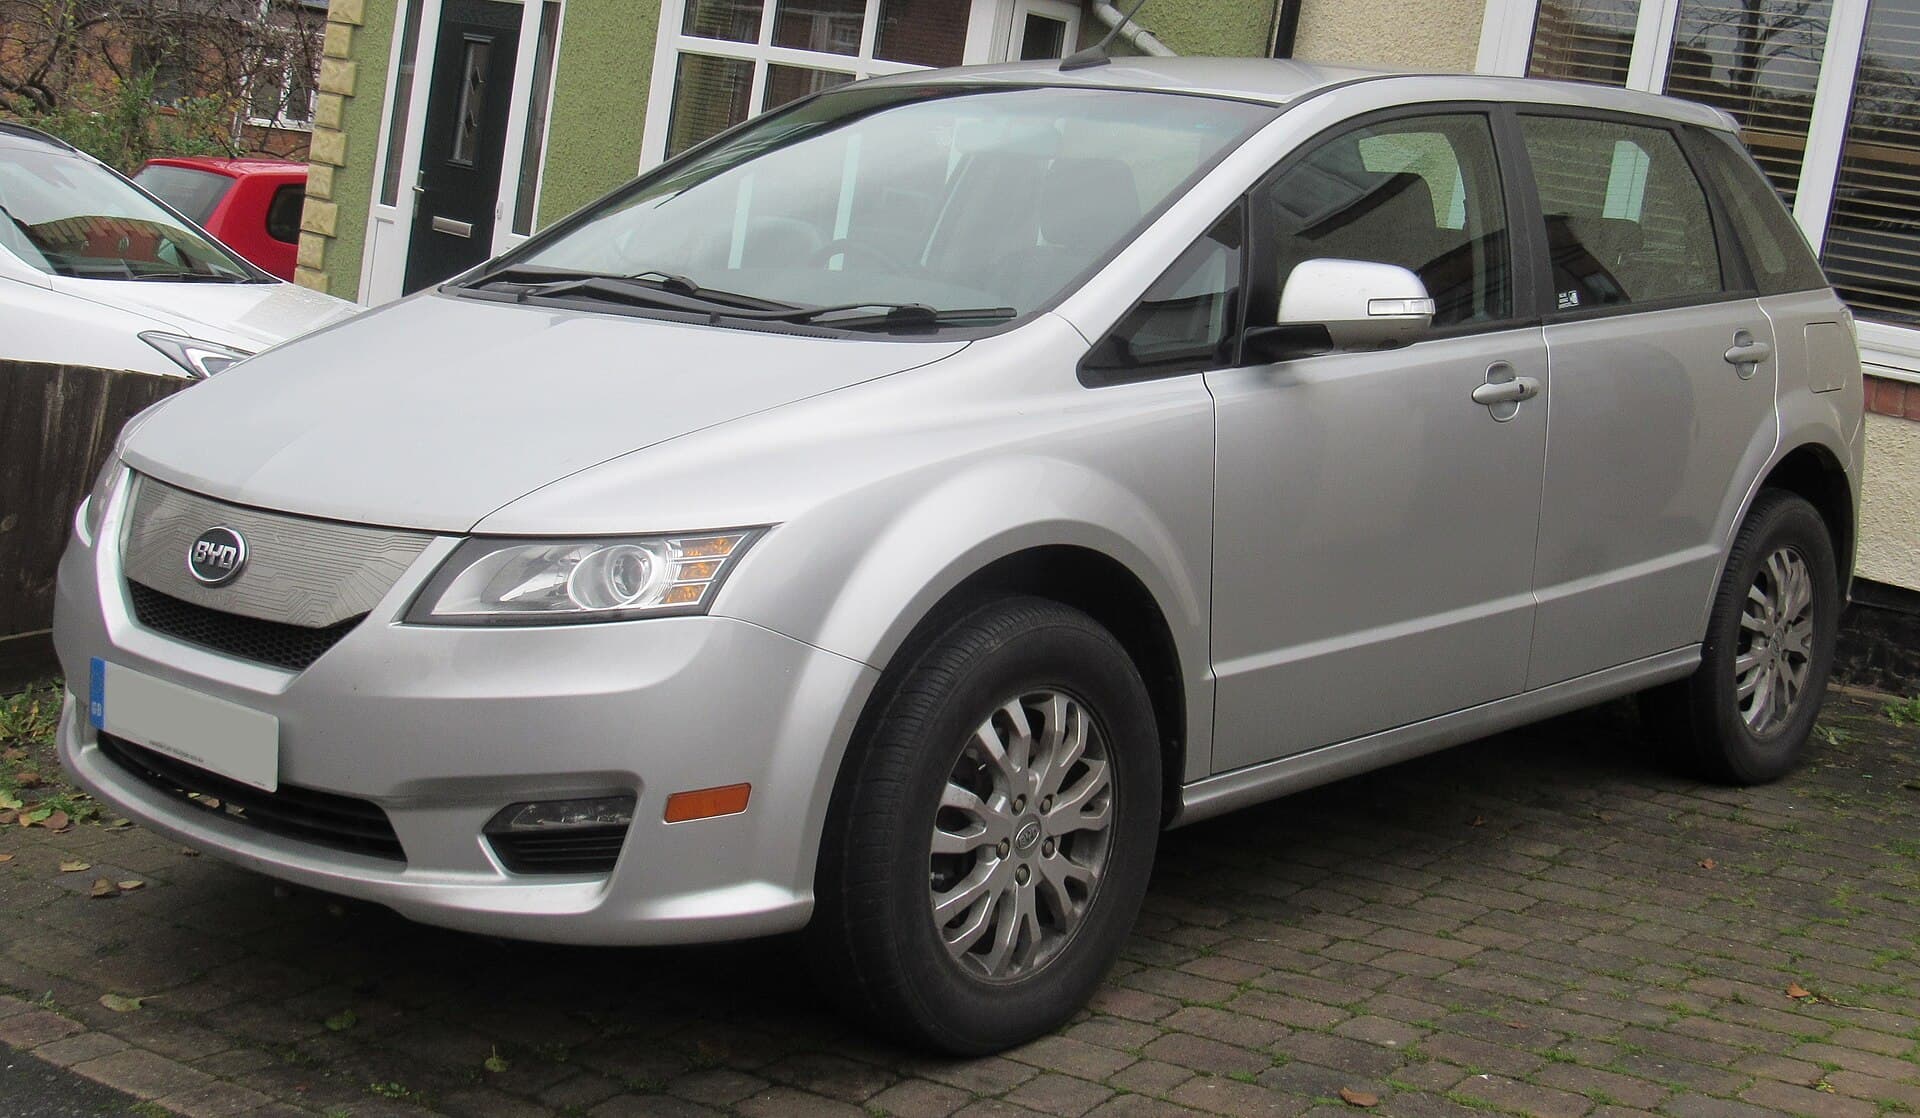
Photo credit
Photo: Vauxford, CC BY-SA 4.0
47.0 kWh/100 mi
Compare the 2017 BYD e6


How this list is made
- Shorter bar, less energy per mile. Bars are measured from zero against the top value; the dark tick marks the average of all 30 ranked here.
- Scores are John’s, shown only where he has scored a car, and they don’t affect the order. How John scores.
- Each car’s page lists the source of every figure and when it was last checked.