Most efficient EVs: 2012 model year
Every EV with a published EPA combined efficiency, lowest energy use first, in kilowatt-hours per 100 miles. Fewer kWh per 100 miles means a cheaper charge for the same distance.
8 of 8 EVs have a published EPA efficiency figure
- 1

Photo credit
Photo: DestinationFearFan, CC BY-SA 4.0
30.0 kWh/100 mi
Compare the 2012 Mitsubishi i-MiEV - 2
32.0 kWh/100 mi
Compare the 2012 Ford Focus Electric - 3

Photo credit
Photo: Makizox, CC BY-SA 4.0
34.0 kWh/100 mi
Compare the 2012 Nissan Leaf - 4
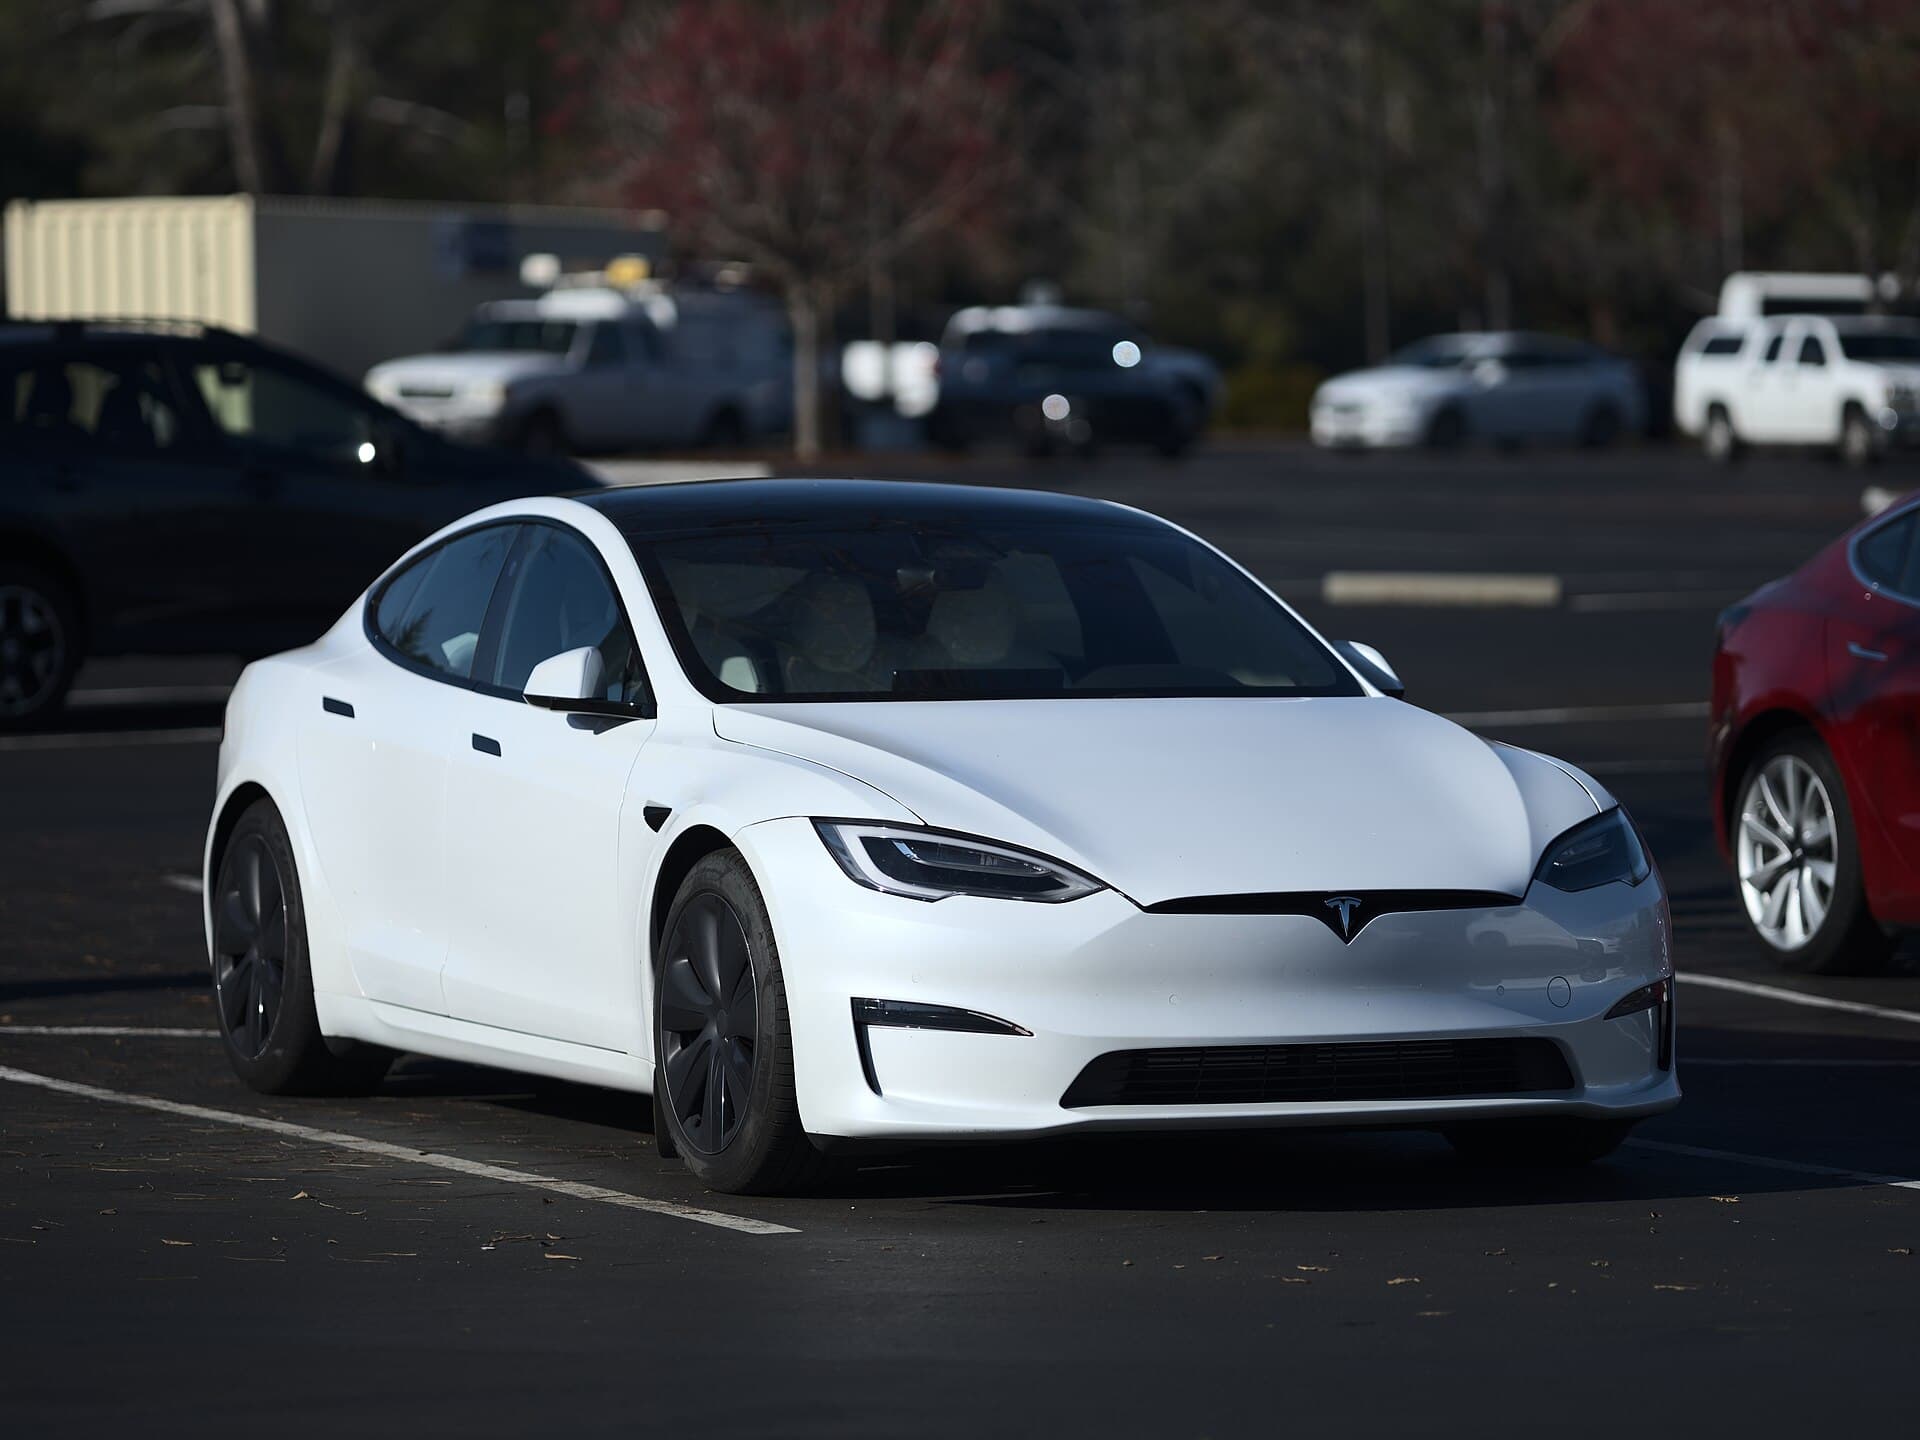
Photo credit
Photo: Dllu, CC BY-SA 4.0
38.0 kWh/100 mi
Compare the 2012 Tesla Model S - 5
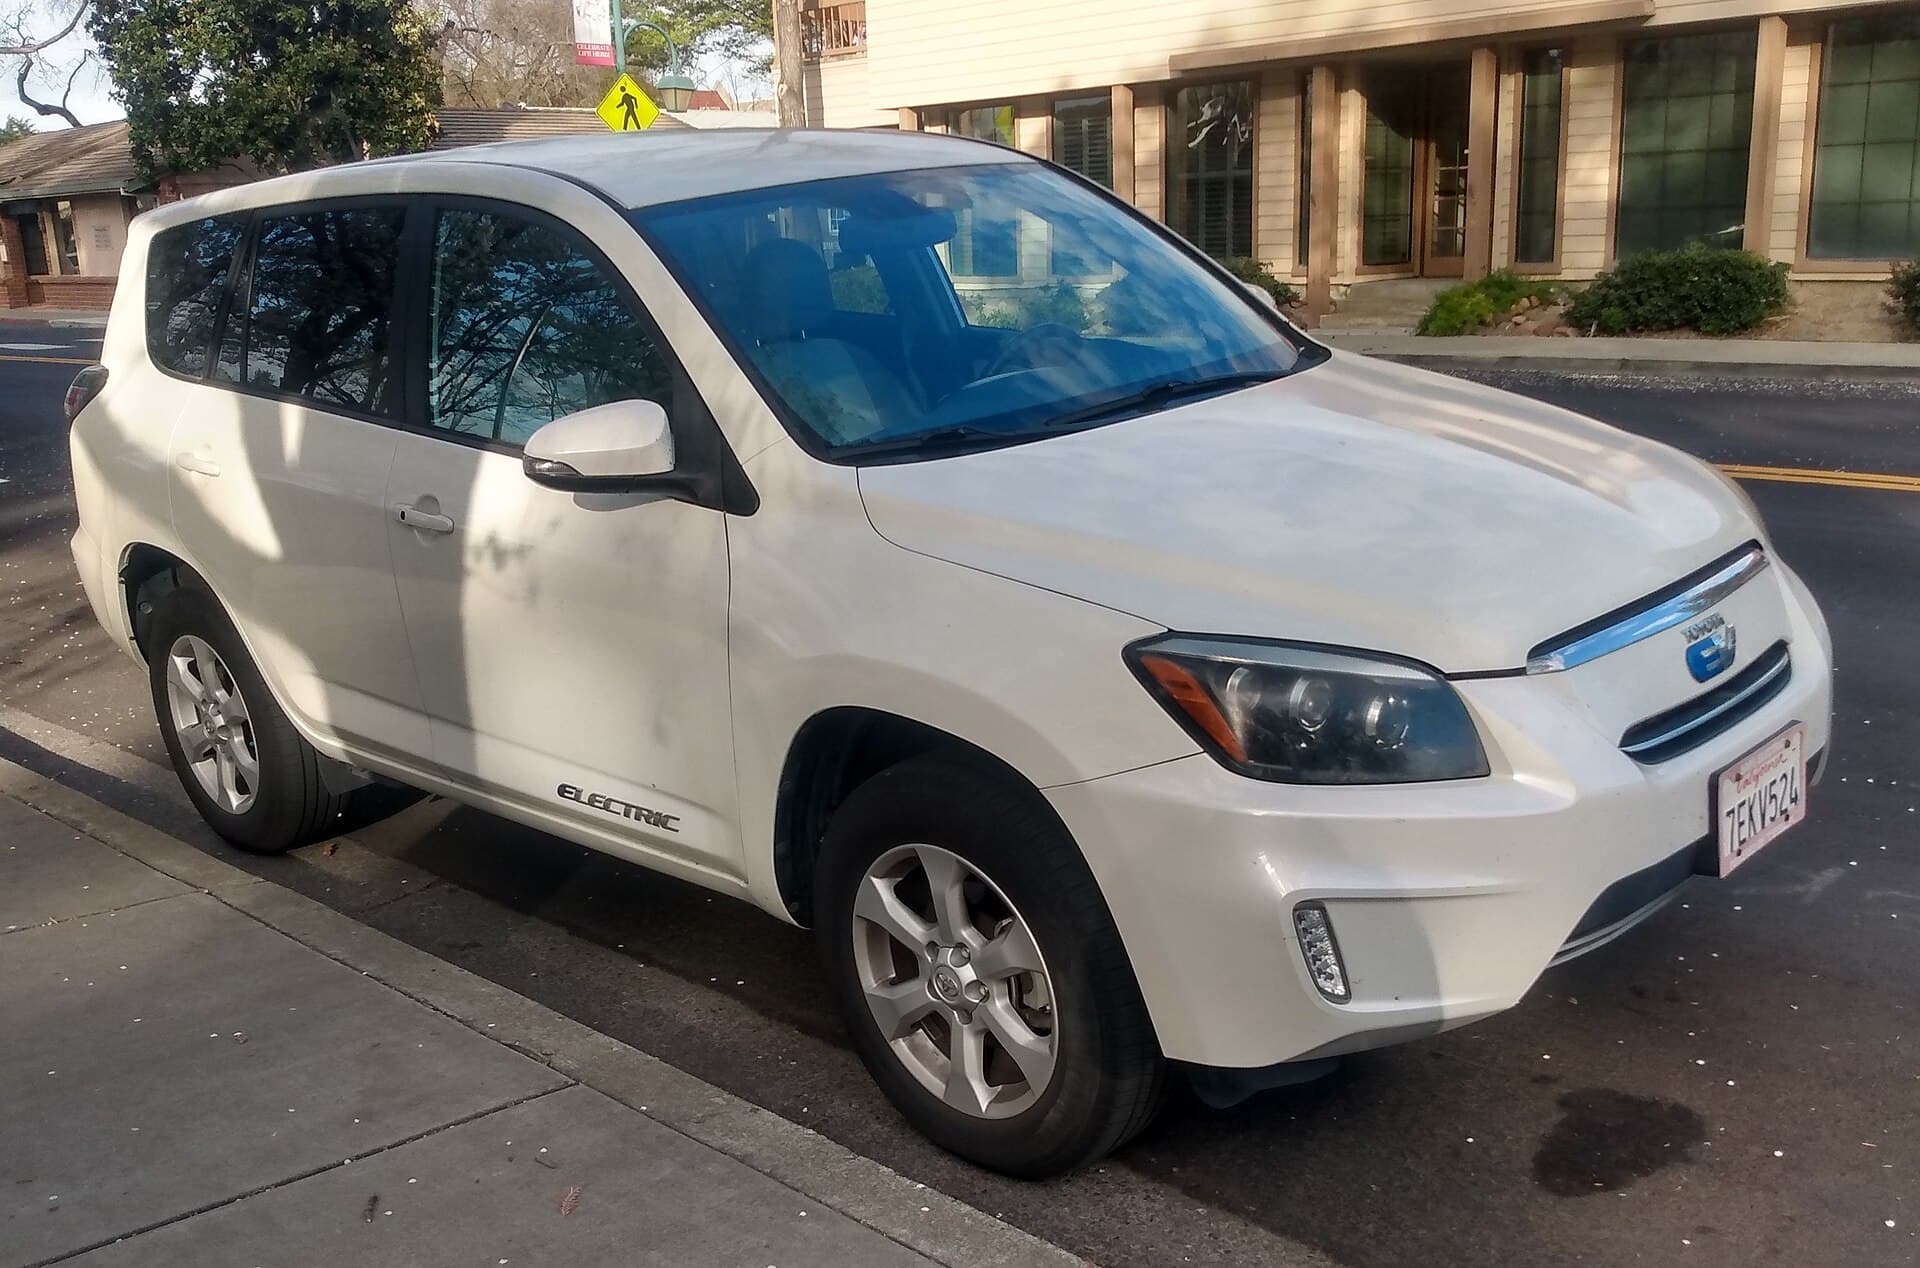
Photo credit
Photo: DestinationFearFan, CC BY-SA 4.0
44.0 kWh/100 mi
Compare the 2012 Toyota RAV4 EV - 6

Photo credit
Photo: U.S. National Highway Traffic Safety Administration, Public domain
46.0 kWh/100 mi
Compare the 2012 Coda Sedan - 7

Photo credit
54.0 kWh/100 mi
Compare the 2012 Azure Dynamics Transit Connect Electric - 7
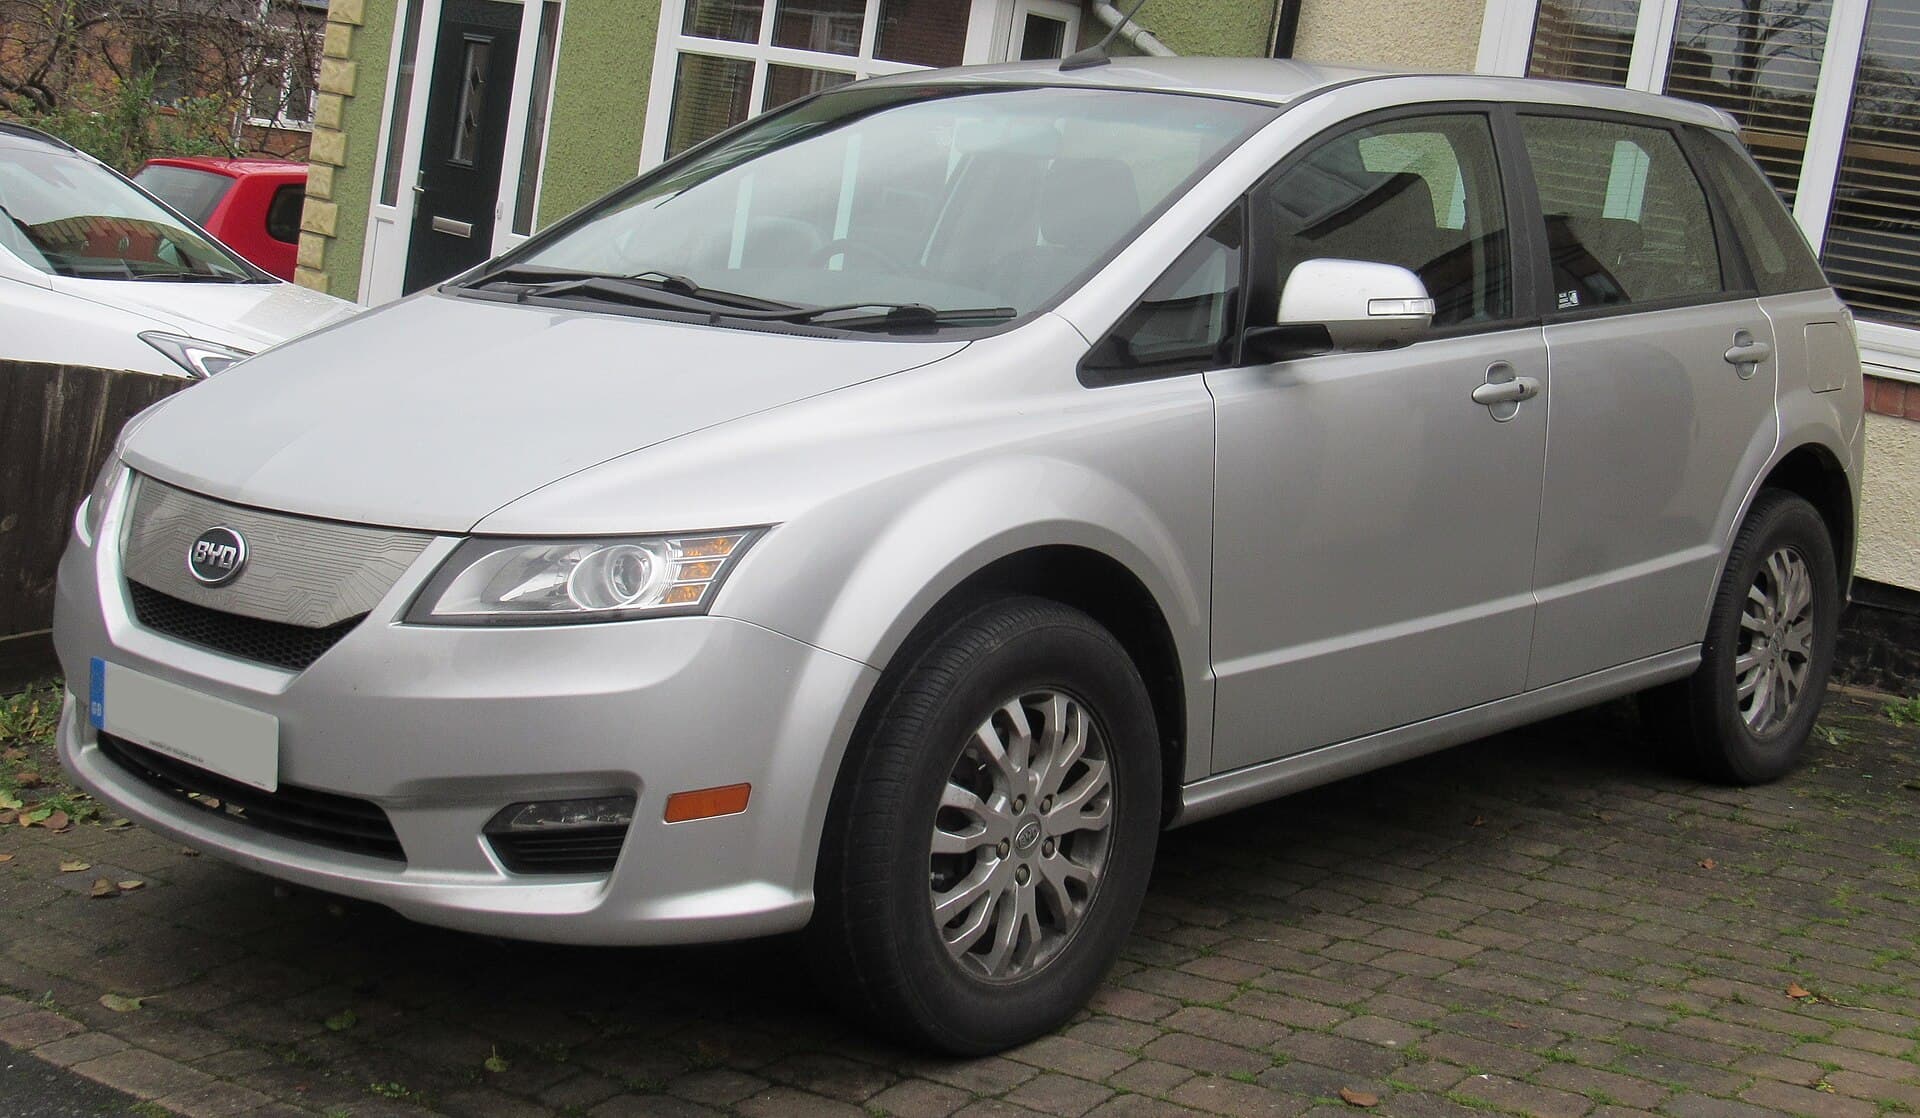
Photo credit
Photo: Vauxford, CC BY-SA 4.0
54.0 kWh/100 mi
Compare the 2012 BYD e6


How this list is made
- Shorter bar, less energy per mile. Bars are measured from zero against the top value; the dark tick marks the average of all 8 ranked here.
- Scores are John’s, shown only where he has scored a car, and they don’t affect the order. How John scores.
- Each car’s page lists the source of every figure and when it was last checked.