Ranking

Most efficient EVs: 2013 model year

Every EV with a published EPA combined efficiency, lowest energy use first, in kilowatt-hours per 100 miles. Fewer kWh per 100 miles means a cheaper charge for the same distance.

Published specs, not John’s test results. His score shows where he has scored a car; it never changes the order.

Data: Efficiency: fueleconomy.gov (EPA) for 14. Values last checked October 24, 2026.

14 of 14 EVs have a published EPA efficiency figure

Average 35.3 kWh/100 mi

  1. 1

    Specs only · not reviewed yet · Discontinued (2013)

    121 MPGe

    28.0 kWh/100 mi

    Compare the 2013 Scion iQ EV
  2. 2
    2014 Fiat 500e
    Photo credit

    Photo: Rutger van der Maar, CC BY 2.0

    Specs only · not reviewed yet · Model years 2013–2026

    116 MPGe

    29.0 kWh/100 mi

    Compare the 2013 Fiat 500e
  3. 2

    Specs only · not reviewed yet · Discontinued (2013–2014)

    118 MPGe

    29.0 kWh/100 mi

    Compare the 2013 Honda Fit EV
  4. 2
    2017 Nissan Leaf
    Photo credit

    Photo: Makizox, CC BY-SA 4.0

    Specs only · not reviewed yet · Model years 2011–2026

    115 MPGe

    29.0 kWh/100 mi

    Compare the 2013 Nissan Leaf
  5. 5
    2012 Mitsubishi i-MiEV
    Photo credit

    Photo: DestinationFearFan, CC BY-SA 4.0

    Specs only · not reviewed yet · Discontinued (2012–2017)

    112 MPGe

    30.0 kWh/100 mi

    Compare the 2013 Mitsubishi i-MiEV
  6. 6
    2012 Ford Focus Electric
    Photo credit

    Photo: Cutlass, CC0

    Specs only · not reviewed yet · Discontinued (2012–2018)

    105 MPGe

    32.0 kWh/100 mi

    Compare the 2013 Ford Focus Electric
  7. 6
    2013 Smart fortwo electric drive
    Photo credit

    Photo: IFCAR, Public domain

    Specs only · not reviewed yet · Discontinued (2011–2018)

    107 MPGe

    32.0 kWh/100 mi

    Compare the 2013 Smart fortwo electric drive Cabrio
  8. 6
    2013 Smart fortwo electric drive
    Photo credit

    Photo: IFCAR, Public domain

    Specs only · not reviewed yet · Discontinued (2011–2018)

    107 MPGe

    32.0 kWh/100 mi

    Compare the 2013 Smart fortwo electric drive Coupe
  9. 9
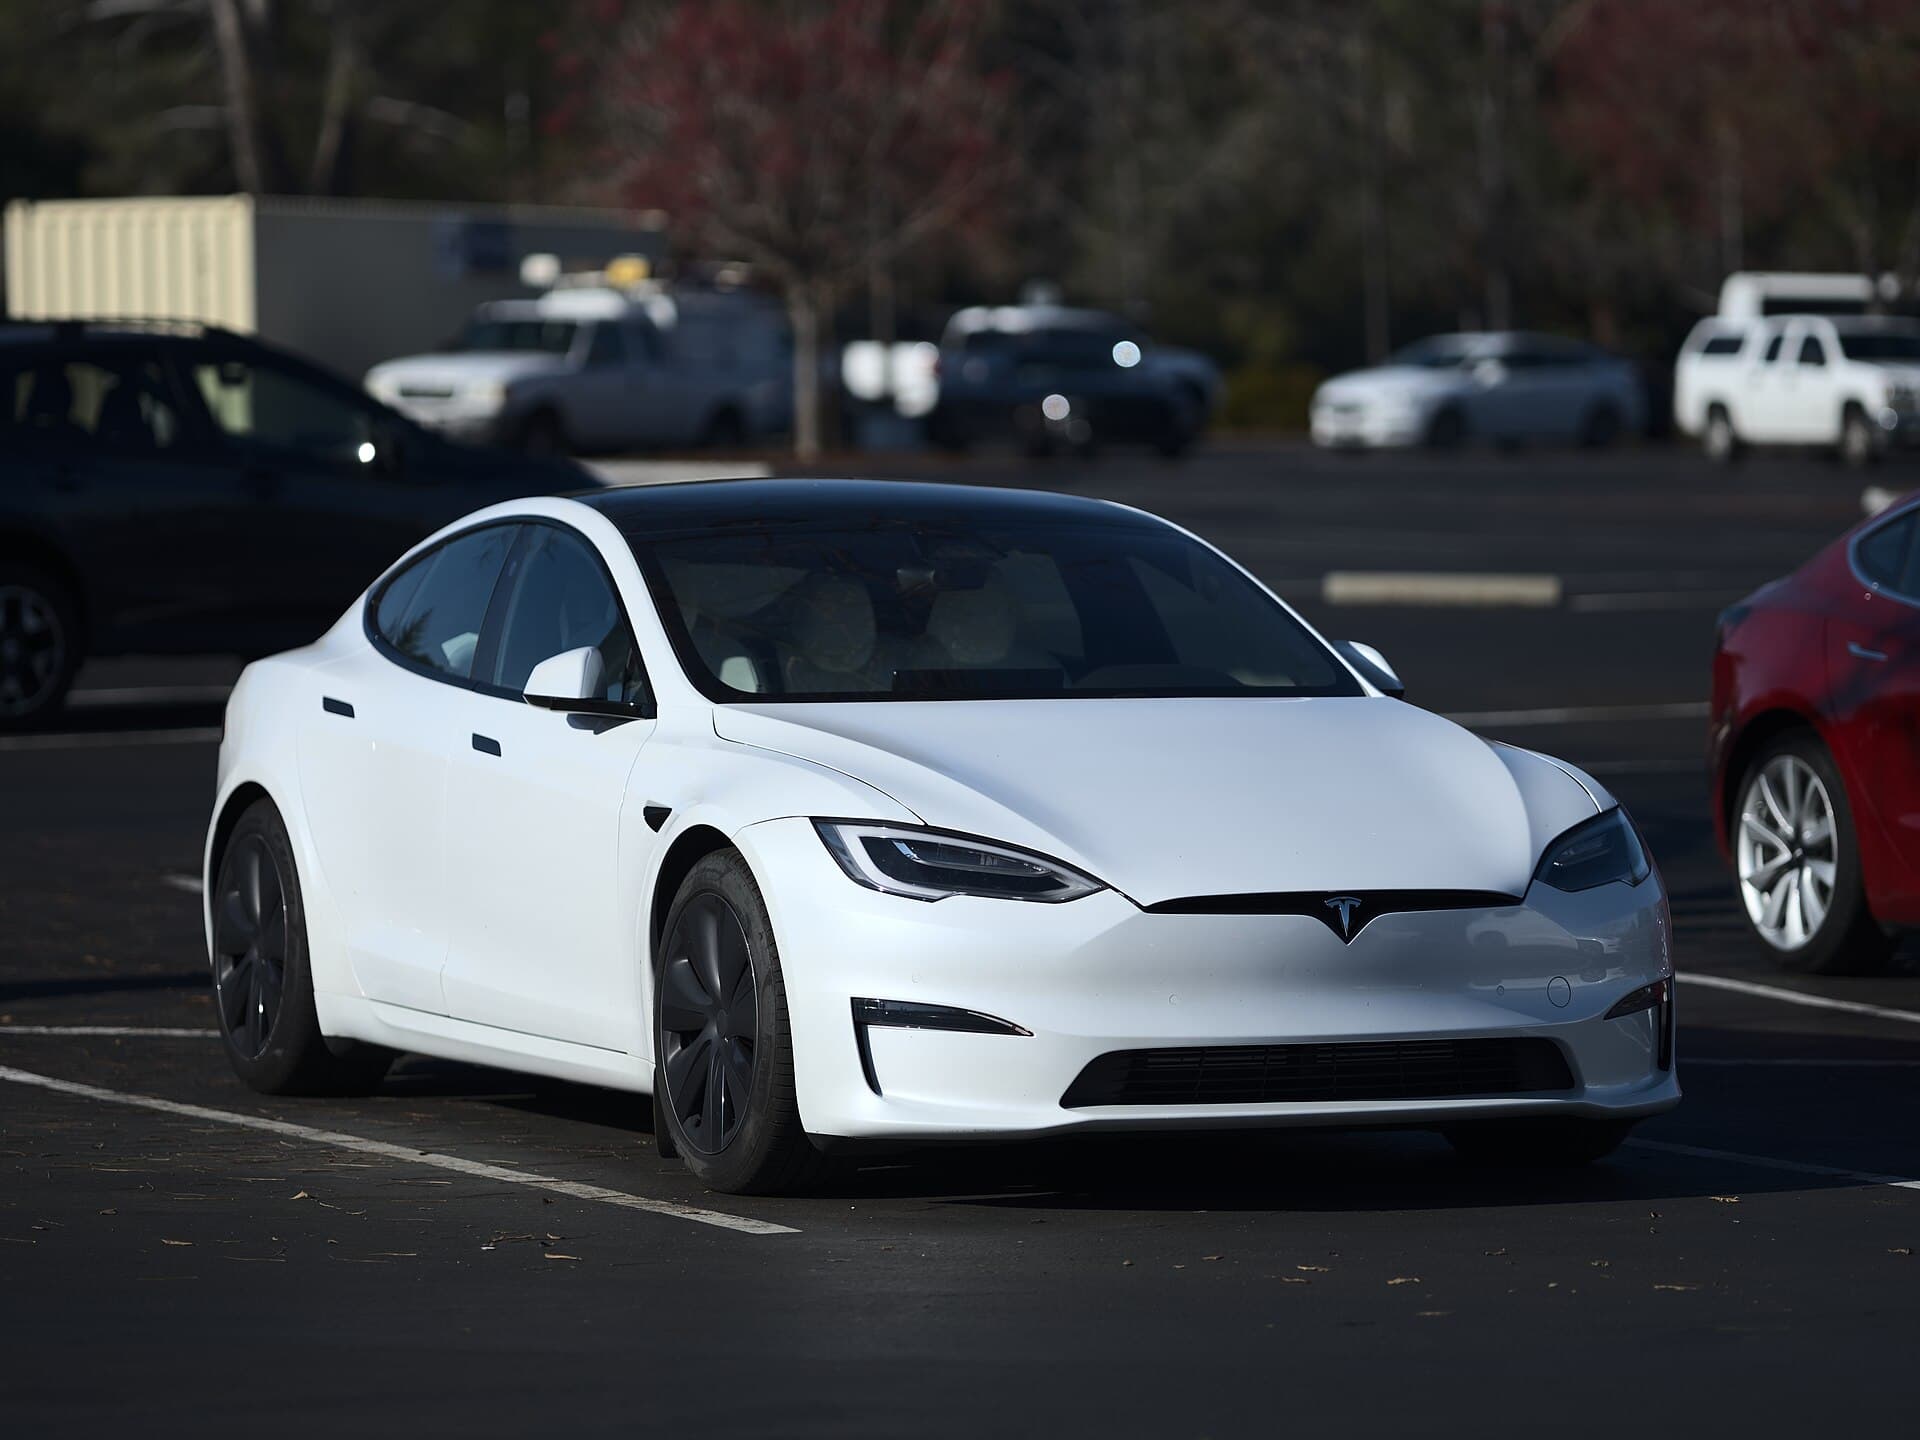
    2021 Tesla Model S
    Photo credit

    Photo: Dllu, CC BY-SA 4.0

    Specs only · not reviewed yet · Discontinued (2012–2026)

    95 MPGe

    35.0 kWh/100 mi

    Compare the 2013 Tesla Model S 60 kWh
  10. 10
    2021 Tesla Model S
    Photo credit

    Photo: Dllu, CC BY-SA 4.0

    Specs only · not reviewed yet · Discontinued (2012–2026)

    94 MPGe

    36.0 kWh/100 mi

    Compare the 2013 Tesla Model S 40 kWh
  11. 11
    2021 Tesla Model S
    Photo credit

    Photo: Dllu, CC BY-SA 4.0

    Specs only · not reviewed yet · Discontinued (2012–2026)

    89 MPGe

    38.0 kWh/100 mi

    Compare the 2013 Tesla Model S 85 kWh
  12. 12
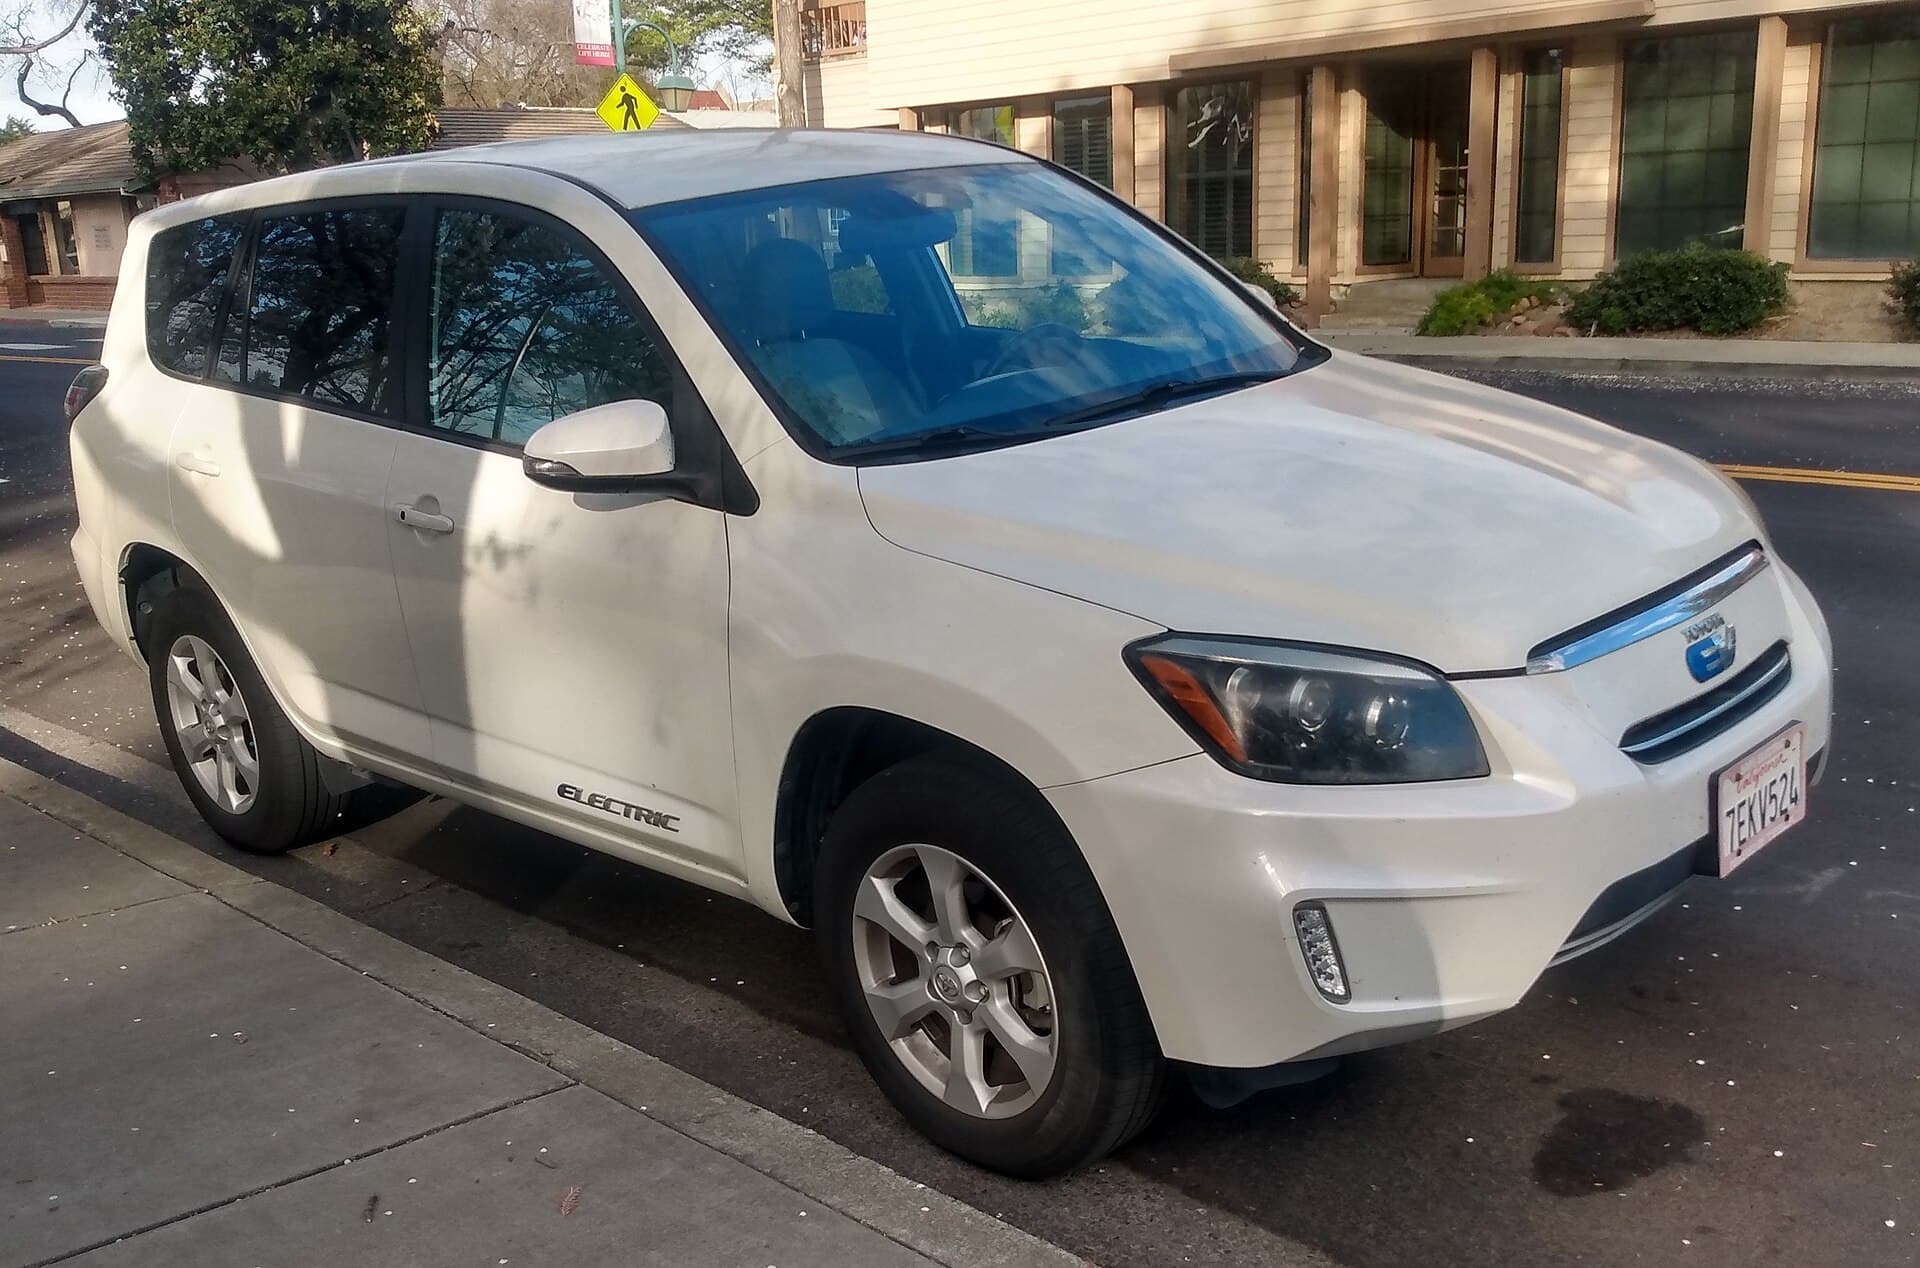
    2014 Toyota RAV4 EV
    Photo credit

    Photo: DestinationFearFan, CC BY-SA 4.0

    Specs only · not reviewed yet · Discontinued (2012–2014)

    76 MPGe

    44.0 kWh/100 mi

    Compare the 2013 Toyota RAV4 EV
  13. 13
    2012 Coda Sedan
    Photo credit

    Photo: U.S. National Highway Traffic Safety Administration, Public domain

    Specs only · not reviewed yet · Discontinued (2012–2013)

    73 MPGe

    46.0 kWh/100 mi

    Compare the 2013 Coda Sedan
  14. 14
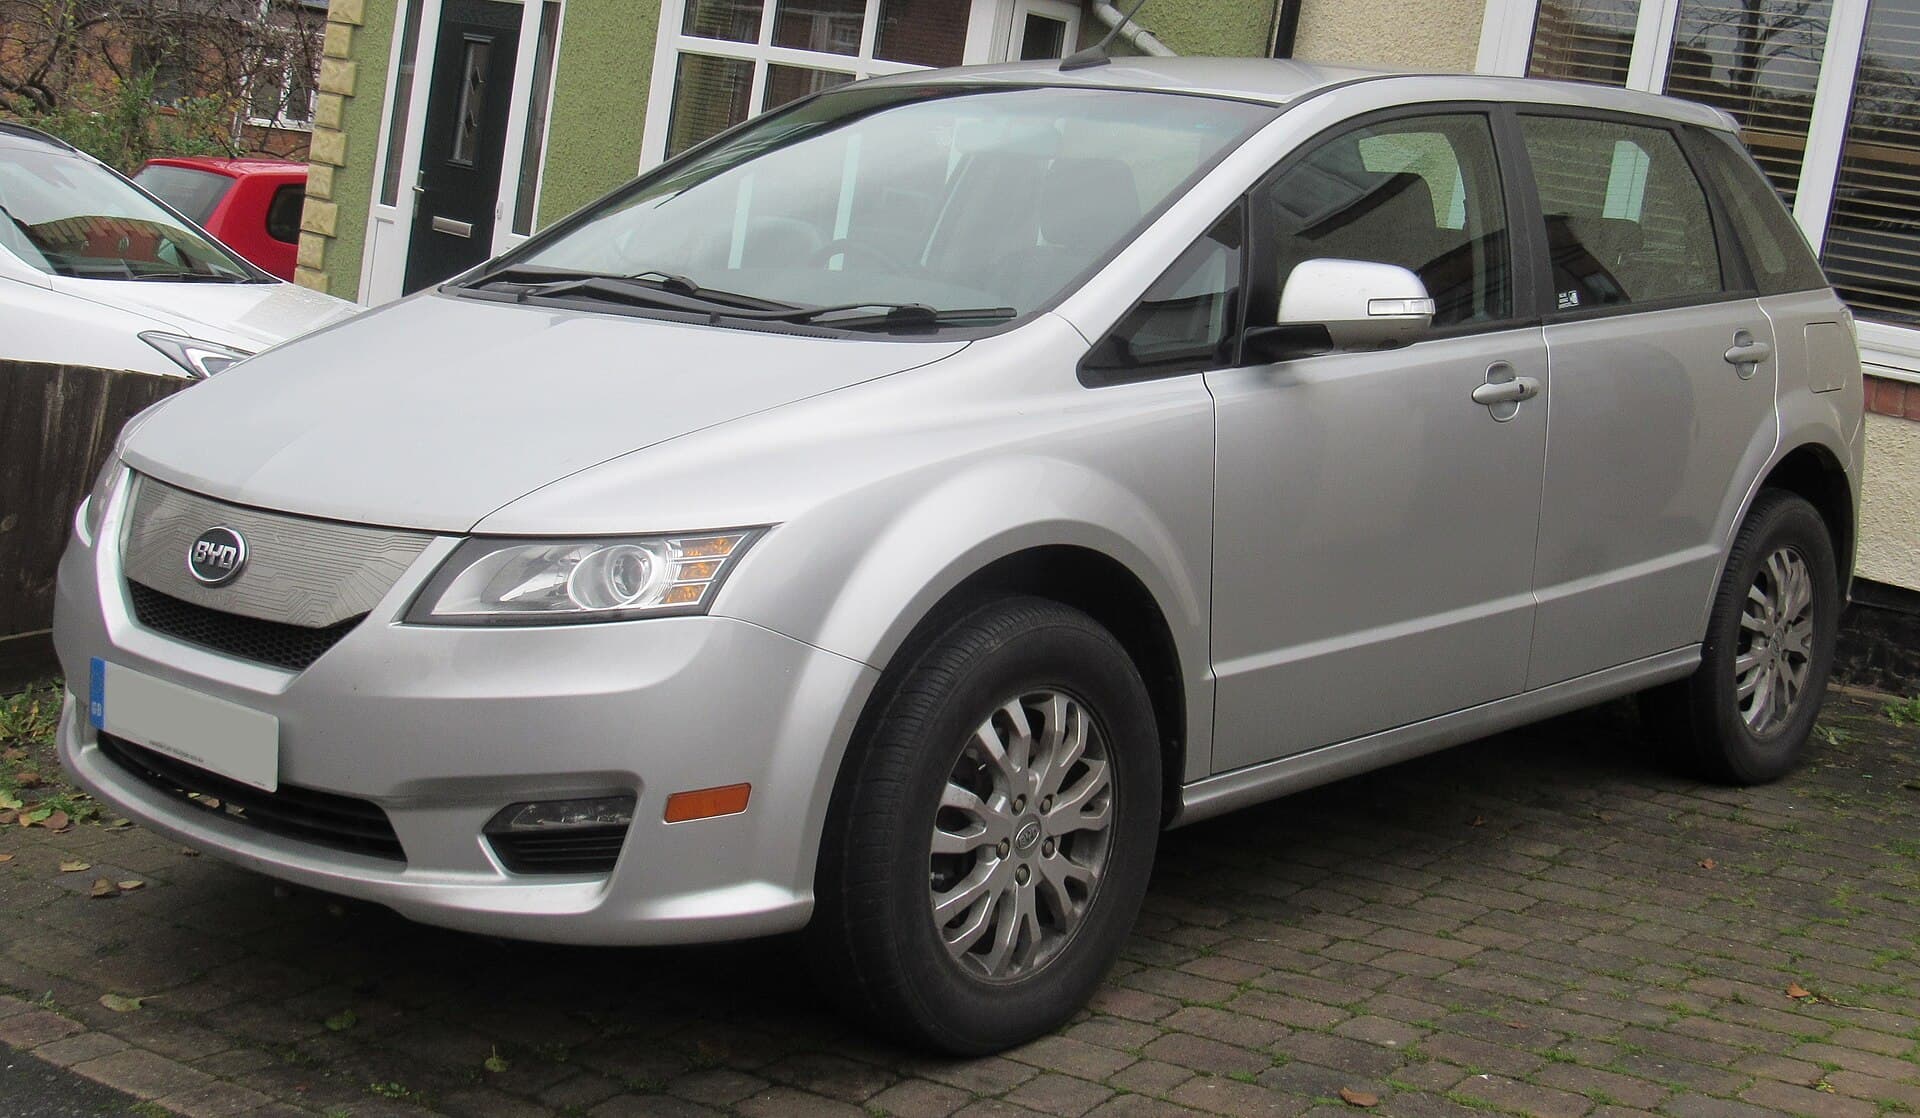
    2014 BYD e6
    Photo credit

    Photo: Vauxford, CC BY-SA 4.0

    Specs only · not reviewed yet · Discontinued (2012–2020)

    63 MPGe

    54.0 kWh/100 mi

    Compare the 2013 BYD e6

How this list is made

  • Shorter bar, less energy per mile. Bars are measured from zero against the top value; the dark tick marks the average of all 14 ranked here.
  • Scores are John’s, shown only where he has scored a car, and they don’t affect the order. How John scores.
  • Each car’s page lists the source of every figure and when it was last checked.

New reviews and scores by email, usually twice a month. Unsubscribe in one click.